This tutorial guides you through building a linear regression model in Python, covering importing libraries, loading data, fitting the model, and interpreting results.
1. Import Libraries
import pandas as pd
from sklearn.linear_model import LinearRegression
2. Load Data
Replace with your actual data source:
# Import Dataset from sklearn
from sklearn import datasets

# Load Iris Data
iris = datasets.load_iris()

# Creating pd DataFrames
iris_df = pd.DataFrame(data= iris.data, columns= iris.feature_names)
target_df = pd.DataFrame(data= iris.target, columns= ['species'])

def converter(specie):
    if specie == 0:
        return 'setosa'
    elif specie == 1:
        return 'versicolor'
    else:
        return 'virginica'

target_df['species'] = target_df['species'].apply(converter)

# Concatenate the DataFrames
iris_df = pd.concat([iris_df, target_df], axis= 1)
x = iris_df["sepal length (cm)"]
y = iris_df["sepal width (cm)"]

#Filter the dataframe
iris_df_setosa = iris_df[(iris_df.species == "setosa")]
iris_df_setosa.head()
| sepal length (cm) | sepal width (cm) | petal length (cm) | petal width (cm) | predicted_y | species | |
|---|---|---|---|---|---|---|
| 0 | 5.1 | 3.5 | 1.4 | 0.2 | 3.503062 | setosa |
| 1 | 4.9 | 3.0 | 1.4 | 0.2 | 3.343356 | setosa |
| 2 | 4.7 | 3.2 | 1.3 | 0.2 | 3.183650 | setosa |
| 3 | 4.6 | 3.1 | 1.5 | 0.2 | 3.103798 | setosa |
| 4 | 5.0 | 3.6 | 1.4 | 0.2 | 3.423209 | setosa |
3. Fit the Model
Create a LinearRegression instance and fit it to the data:
# Run the regression
x = iris_df_setosa["sepal length (cm)"]
y = iris_df_setosa["sepal width (cm)"]

model = LinearRegression()
model.fit(x.values.reshape(-1, 1), y.values.reshape(-1, 1))
iris_df_setosa["predicted_y"] = model.predict(x.values.reshape(-1, 1))

r_sq = model.score(x.values.reshape(-1, 1), y.values.reshape(-1, 1))
print(r_sq)
print(f"intercept: {model.intercept_}")
print(f"slope: {model.coef_}")
# intercept: [-0.56943267]
# slope: [[0.7985283]]

r_sq = model.score(x.values.reshape(-1, 1), y.values.reshape(-1, 1))
print(r_sq)
# 0.5513755803923133
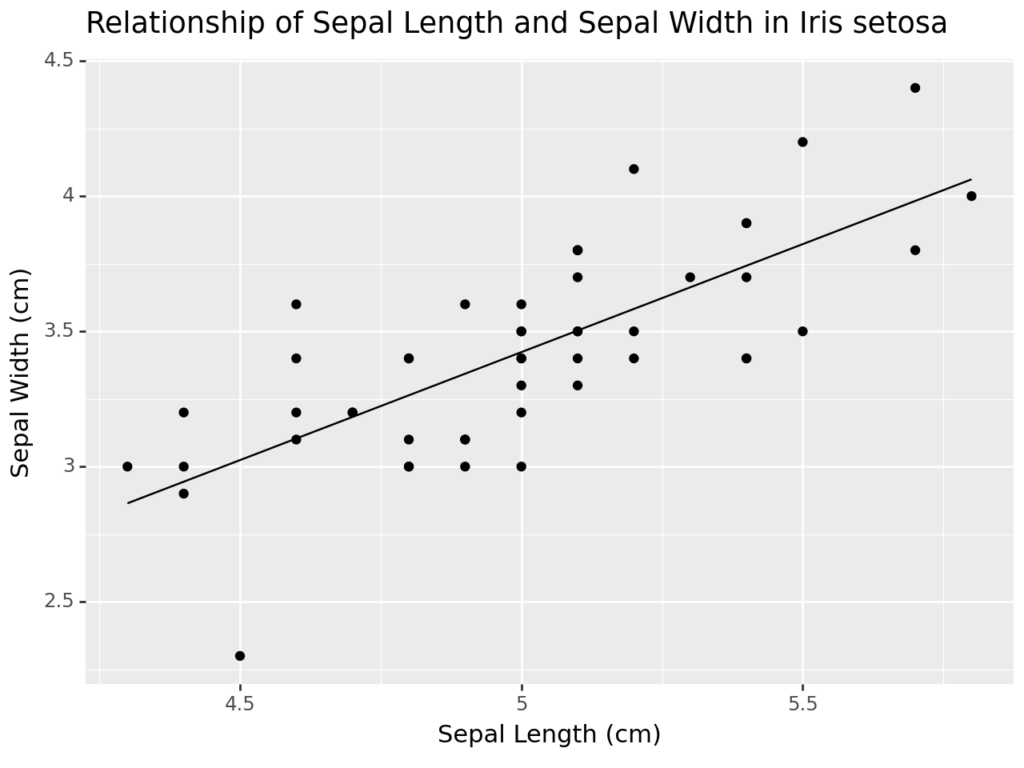
4. Plot the results
# Running pip to install plotnine may be required
pip install plotnine
import plotnine as p
from plotnine import *

plot = (
    ggplot(iris_df_setosa, aes(x="sepal length (cm)", y="sepal width (cm)"))
    + geom_point()
    + geom_line(aes(x="sepal length (cm)", y="predicted_y"))
    + labs(title="Sepal Length and Sepal Width", x="Sepal Length (cm)", y="Sepal Width (cm)")
)

print(plot)

References
Leave a Reply